Deaching of the great explorer of the truth the builder

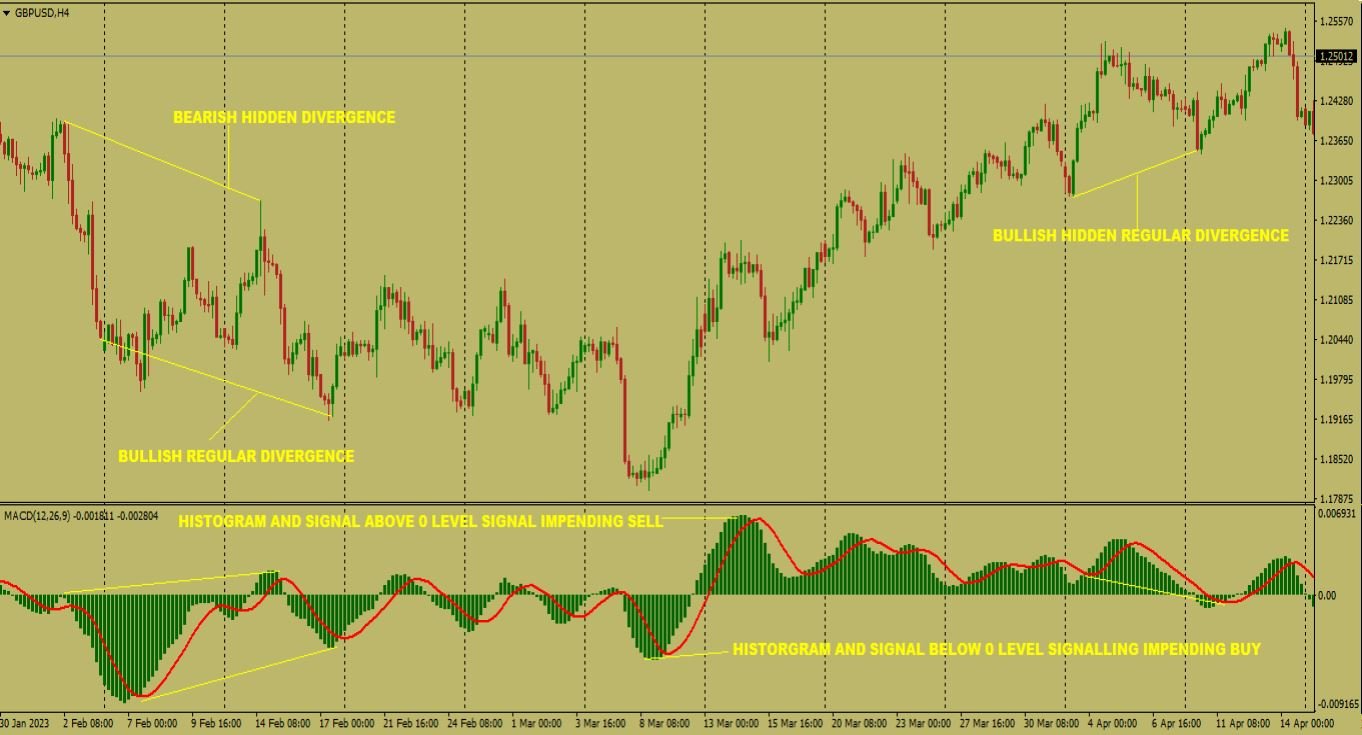
The MACD Trading Strategy uses the MACD indicator which is an oscillator commonly used by traders in trading. It is composed of the histogram and the signal line.
The indicator functions in different ways depending on the way a trader uses it. It’s useful as an oscillator to find buy signals when the histogram and signal are below the 0 line in an extended way. And when the histogram and signal line is above the 0 line in an extended way we start looking for sell trades.
The MACD can be used to spot divergence on the chart when price and indicator are moving in contrary manners.
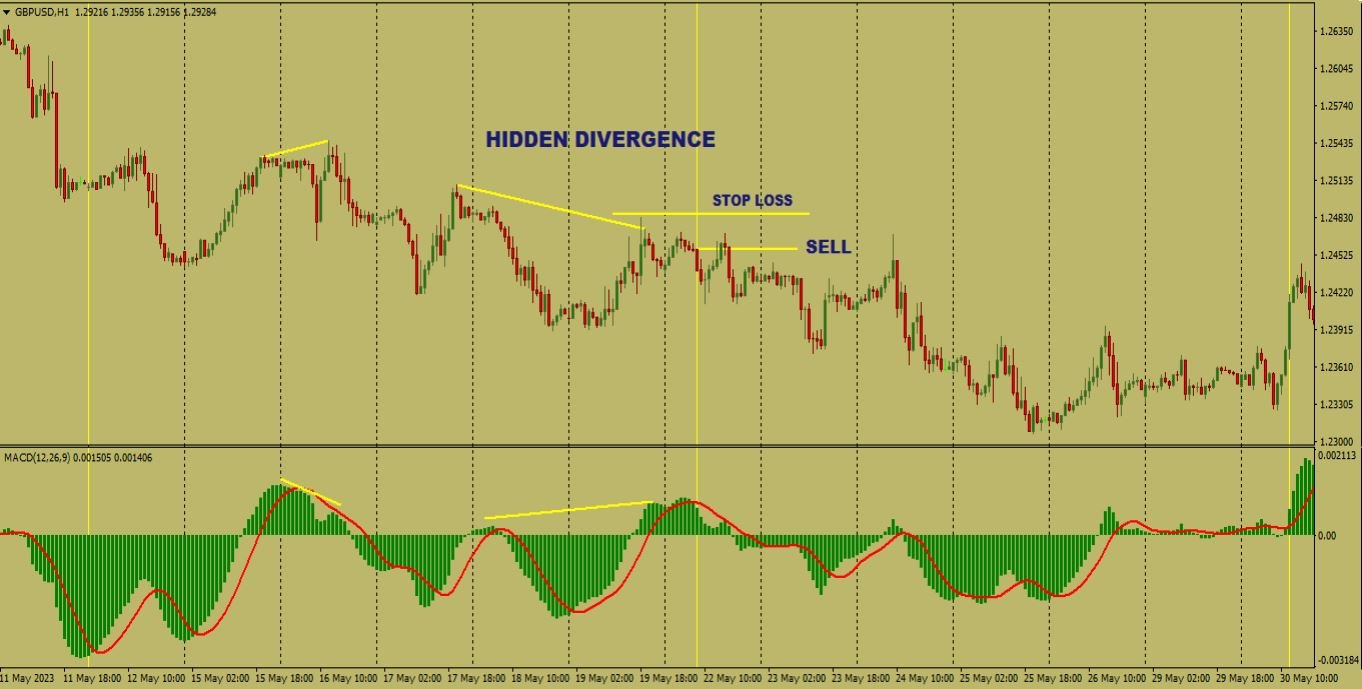
When the MACD is above 0 level on the daily time frame (HTF), look for divergence on 1H time frame (LTF). Enter a buy trade when the histogram crosses the signal line. Use the swing low as the SL and hold the trade till MACD histogram crosses below signal line.


When the MACD is below 0 level on the Higher Time Frame, look for divergence on Lower time frame (LTF). Enter a sell trade when the histogram crosses the signal line. Use the swing high as the SL and hold the trade till MACD histogram crosses below signal line.

Leave A Comment